DCE MRI analysis is required to relate measured data to the parameters
of the tissue or organ of interest. These parameters have been
increasingly used in individualized medicine for disease diagnostics,
treatment planning, and predicting and monitoring response to treatment.
Compartmental modeling provides fully quantitative physiological parameters.
Compartmental models represent tissues and organs as combinations of uniform,
instantly mixed compartments. Models usually require a vascular input function
(IF) driving the system. The input function is usually the concentration
of contrast in a vessel feeding the tissue of interest.
Some models require more than one IF, such as the liver models,
which may have two IFs, arterial and portal venous, reflecting
the hepatic blood supply.
In FireVoxel, several compartmental models are available under
Dynamic Analysis > Calculate Parametric Map for the analysis
of compatible DCE MRI data.
The following describes two-compartment Tofts models (regular and
extended), widely used for analyzing DCE MRI in cancer and other diseases:
Model 8: Tofts two-compartment exchange model {k-trans, Ve} : 1IF (single
input function);
Model 9: Modified Tofts two-compartment exchange model {k-trans, Ve, Va} : 1IF.
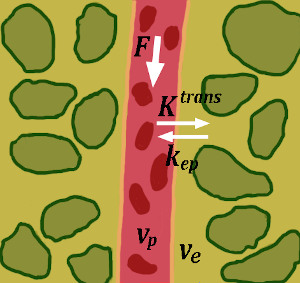
The two-compartment tracer kinetic models describe the scenario, in
which intravenously injected contrast agent enters the bloodstream, and
(in body tissues) distributes throughout the vasculature and the EES,
with bidirectional exchange between the vascular compartment and the EES
compartment across the vessel walls (Fig. 35.1).
Fig. 35.1 Contrast in tissue exchanges between vascular and EES compartments.
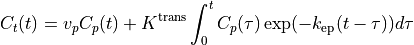
The extended Tofts model [Tofts1999] predicts the contrast
concentration as a function of time in the tissue of interest
fed by a blood vessel with the plasma concentration
:
The concentration in the vascular compartment is considered to be the
same as the concentration in the feeding vessel, which serves as the
arterial input function (AIF). The model parameters include the vascular
volume fraction (unitless), the volume transfer constant
(measured in mL/min/mL, i.e., mL/min per mL of tissue)
and the rate constant (1/min),
where (unitless) is the fractional EES volume.
The regular Tofts model ignores the contribution of the vascular
compartment, when the vascular volume fraction is small
(), which may be an appropriate approximation for
tissues that are not highly vascularized:
In the body, the volume transfer constant
typically reflects a combination of tissue perfusion
(blood flow, F in Fig. 35.1) and
vessel wall permeability (leakiness). In contrast, in the brain with
mostly intact blood-brain barrier (BBB), where low molecular weight
GBCAs mostly intravascular, is mostly a measure
of vascular permeability, which is low in healthy brain and may
be elevated in areas of injury or tumors, where BBB may be disrupted.
The rate constant describes the rate of
the contrast washout from EES back into the vasculature.
The Tofts model parameters scale with the AIF and, as a result, are
sensitive to the AIF errors. Special care must be exercised to ensure
robust measurements of the Tofts model parameters and their intrapatient
repeatability in longitudinal studies.
Users are urged to consider the issues that may affect the reliability
of the AIF measurements in their experiments.
DCE MRI analysis requires the following components:
DCE MR images (4D dynamic dataset);
Segmentation masks for tissues or organs of interest (optional);
Input function (IF) saved as a text file;
Precontrast blood T10 value -
A fixed T1-value is required (see T10 of Blood);
Precontrast tissue T10 value - Either a fixed value
or a voxel-by-voxel T1-map. The T1-map may be generated from
a separate dataset, such as inversion recovery or multiple
flip angle acquisitions;
Modeling options - Model, output parameters, and modeling regime
(voxel-based or average curve-based).
The following sequence of steps may be executed to perform DCE MRI model analysis:
1. Open images.Open dynamic images into FireVoxel and Save
them as a FireVoxel document. See Loading DWI data
for details of loading 4D datasets.
2. Segment the tissue or organ of interest.
If model analysis is performed only for a tissue or organ of interest,
this tissue or organ need to be segmented. Segmentation can be performed manually,
by drawing an ROI (see Draw Raster ROIs) or using commands under
the ROI menu (see ROI), or via automatic segmentation
(such as Segmentation 3D (EdgeWave)).
This step will create one or more ROI layers. Name these layers clearly
to make them easy to distinguish (see Layer Control
for how to rename layers).
3. Determine the input function.
The input function must be saved as a text file with at least two columns of data:
(1) time and (2) signal intensity or concentration (in mmol/L). The input function may be derived
using a variety of methods, including FireVoxel’s Image Derived Input Function.
4. Set the precontrast T10value.
The T10 is required to convert the MR signal to contrast concentration.
For blood, a fixed value T10 is assumed (see 5.2).
For tissue, two scenarios are possible:
4.1 Single T10 value.
A single, fixed T10 value is set for each ROI layer,
corresponding to the tissue or organ. In this case, the tissue signal intensity
data are fitted directly and the signal-to-concentration conversion is combined
with model analysis. To set T10 for an ROI, open
Layer Control and make this ROI layer active.
Click Attributes in the lower right corner of
the Layer Control).
This opens a dialog (Tissue attributes) to enter the T10 (in seconds).
The default value is fixed at T10 = 1 s. Click OK.
Repeat these steps for each ROI layer for which the model analysis will be performed.
4.2 Voxel-based T1-map.
The conversion of the 4D DCE MRI data can be performed voxel-by-voxel using a coregistered
voxel map of T10. In the current implementation (Build 368 and newer), the DCE MRI data
must be first converted to concentration and then subjected to model analysis.
The T1-map must be present in the same document as the DCE MRI data as a visible,
real-valued layer named T1-map. Since the T1-map is usually created in another document,
see Coregister with DICOM Tags and Copy layers
for how to superimpose the T1-map with the DCE MRI data.
To convert DCE MRI data to concentration, select Dynamic Analysis >
Convert Volume to concentration > using T1-map.
This opens the Concentration Conversion Dialog
to select the conversion parameters. The concentration results are returned as a new 4D dataset
in an automatically created real-valued layer. This new layer is named after the original data
with the suffix indicating the conversion method.
5. Configure model analysis.
Select Dynamic Analysis > Calculate Parametric Map.
This opens Parametric Map Calculation for Dynamic Experiment dialog,
where the user can configure the model analysis and select the model parameters.
5.1 Select the model.
Use the Model dropdown menu to select the compartmental model:
Model 8 (regular Tofts model), Model 9 (extended Tofts model),
or another model.
5.2 Specify the input function (IF).
In the Input function section, click Load to browse for file and select
the IF file (.txt). Alternatively, use Paste to load the IF data from clipboard.
Click View to preview the IF curve. Note whether the IF is signal or concentration.
5.2.1 If the IF data are concentration (in mmol/L), make sure that the box
next to the Concentration button shows No conversion and proceed to step 6.
5.2.2 If the IF data are signal intensity, set up the conversion to concentration.
Click Attributes and enter the blood T10 (in seconds).
Next, click Concentration to open the
Concentration Conversion dialog
and enter the required parameters for blood/plasma.
6. Set up the tissue signal to concentration conversion.
The signal to conversion is set using Tissue concentration located
in the left half of the Parametric Map dialog under the Hyperparameters section.
The settings depend on the tissue data:
6.1 Tissue data are concentration:
Make sure that the box next to Tissue concentration shows No conversion.
6.2 Tissue data are signal intensity:
Click Tissue concentration to open the
Concentration Conversion Dialog
and enter the conversion parameters for the tissue of interest.
Note: The correction for hematocrit is not applicable in this case.
7. Set hyperparameters and select output parameters.
Hyperparameters are fixed input parameters of the model or parameter limits.
Output parameters are the results that are returned as separate layers;
at least one output parameter must be selected.
(see below Hyperparameters and outputs for Tofts model).
8. Set Optimization and Noise processing options.ADD DETAILS
9. Select the fitting option.
These options include Process All (analyze entire image voxel by voxel),
Process ROI Only (analyze only ROI voxel by voxel), or
Process ROI as a single curve (average ROI signal and analyze
the average curve). See Fitting options
and Results for details.
10. Start analysis.
When the user clicks on the fitting option, the next step is different
for curve processing or voxel fitting:
10.1 Process ROI as a single curve.
The analysis is performed right away and results returned in a dialog.
10.2 Process ROI only or Process All.
A confirmation dialog with the summary of model, inputs and options
is shown giving the user an additional control step before launching
voxel fitting, which may be time consuming. Once the user clicks OK
on this dialog, model analysis commences. The results are returned
as parameter maps, each in its separate layer.
35.3.1. Hyperparameters and outputs for Tofts model
Hyperparameters (the same set for Models 8 and 9):
K-trans max (1/min) – Maximum allowed value of Ktrans.
Ve max – Maximum value of EES fractional volume ve.
Max arterial delay (sec) – Maximum time interval between the bolus
arrival time and the tissue concentration rise.
Optimization depth – ADD DETAIL
Use L1\L2 residual metric – Default, 2.
The choice of L1 or L2 norm to compute the residual.
L2 norm is the default for the output residual.
Use balanced solution (0\1) – Default, 1. ADD DETAIL.
Output:
Ktrans – Volume transfer constant Ktrans (1/min).
Ve – EES volume fraction ve (unitless fraction).
Va (only for Model 9 (extended Tofts model)) – Vascular volume fraction
vp (unitless fraction).
Arterial_delay – Time interval (in seconds) between the bolus arrival time
and the tissue concentration rise.
Residual – Goodness of fit measure, expressed as L1 or L2 norm,
as selected under Hyperparameters (L2 by default).
Tofts PS, Brix G, Buckley DL, et al. Estimating kinetic parameters from
dynamic contrast-enhanced T(1)-weighted MRI of a diffusable tracer:
standardized quantities and symbols. J Magn Reson Imaging. 1999;
10(3):223-32.
PMID: 10508281
Yankeelov TE, Cron GO, Addison CL, et al. Comparison of a reference
region model with direct measurement of an AIF in the analysis of
DCE-MRI data. Magn Reson Med. 2007;57(2):353-61.
PMID: 17260371
 fed by a blood vessel with the plasma concentration
 :
:
 (unitless), the volume transfer constant
 (measured in mL/min/mL, i.e., mL/min per mL of tissue)
and the rate constant
(measured in mL/min/mL, i.e., mL/min per mL of tissue)
and the rate constant 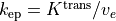 (1/min),
where
(1/min),
where  (unitless) is the fractional EES volume.
 ), which may be an appropriate approximation for
tissues that are not highly vascularized:
), which may be an appropriate approximation for
tissues that are not highly vascularized: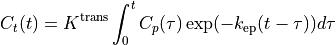
 describes the rate of
the contrast washout from EES back into the vasculature.
describes the rate of
the contrast washout from EES back into the vasculature.