Radiomics extracts multiple features from medical images using
data-characterization algorithms. These features may reveal patterns
and properties of tissues and lesions that are not apparent to
an observer’s eye.
FireVoxel offers automatic workflows for measuring the first- and second-order
radiomics features with a minimal user interaction.
The workflows require an image (acquired or computed) and (optional) one or
more visible ROIs. If there are no visible ROIs, the analysis is performed
using the entire image (which may not be informative).
To use, open image in FireVoxel, create or load the ROI layer(s) and make sure
they are visible. Select Measure > Radiomics Features 2D - Active ROI or
Radiomics Features 2D - All ROIs, depending on the ROI(s) present.
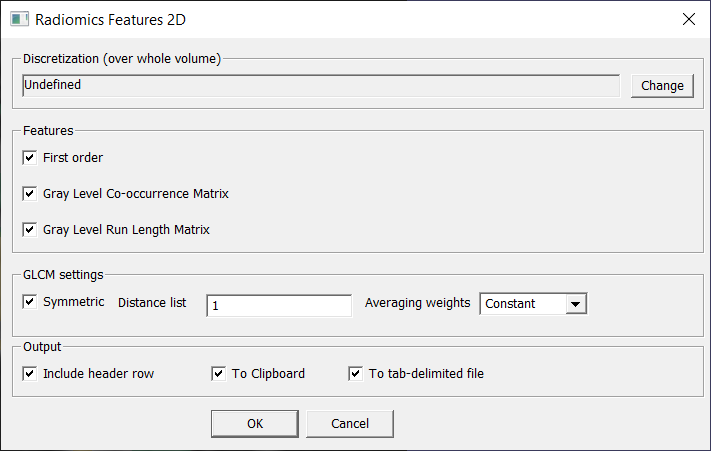
This will open the Radiomics Features 2D dialog described in detail in the next section.
Adjust the parameters and output options and click OK. The results will be returned
to the clipboard and/or to a text file (depending on user selections).
Import or paste the results into a spreadsheet for further analysis.
Discretization (over whole volume) [text window] – Displays parameters of the signal
histogram (Range [min, max], Bin width(real), Bins(int), Clip range(int)). Default: Undefined.
Click Change to the right from the text window to change these parameters.
This opens ROI Stats 3D dialog, which
enables the user to change the histogram parameters. After the user clicks OK,
this dialog closes, and the histogram parameters appear in the Discretization box.
Important Note: It is important NOT to accept the default histogram values,
which are image-specific.
Features – Checkboxes to select the main radiomics feature groups.
Check to compute these features and return them in the results file.
First order – First-order parameters of signal distribution, including
Min, Max, Mean, Variance, Skewness, Kurtosis, Entropy and percentiles (1%, 5%, 10%,
25%, 50%, 75%, 90%, 99%).
Gray Level Co-occurrence Matrix (GLCM) – See detailed description below.
Gray Level Run Length Matrix (GLRLM) – See detailed description below.
GLCM settings – Customize settings to compute GLCM.
Symmetric – Checkbox to select symmetric GLCM (default: checked, symmetric).
Distance list – Text box to enter an integer.
Averaging weights – Dropdown menu to select an option for averaging weights: No averaging,
Constant (default), Infinity norm, Euclidian norm, Manhattan norm.
Output – Output options for results.
Include header row – Include output parameter names in the first line of the results file.
To Clipboard – Copy results to clipboard. To paste results into another application
(such as Excel), press Ctrl + V. If Include header row is checked, the results contain
a row of text labels (parameter names) followed by numerical parameter values.
To tab-delimited file – Create a file (NotepadTempFile.txt in FireVoxel’s Temp directory)
with tab-delimited results. If Include header row is checked, the results file contains
a row of text labels (parameter names) followed by numerical parameter values.
First-order features describe the distribution of voxel intensities within ROI through
the commonly used metrics and moments.
Min – Minimum signal intensity.
Max – Maximum signal intensity.
Mean – Signal mean.
Variance – Signal variance (squared deviation from the mean).
Skewness – Skewness, a measure of asymmetry of signal distribution.
Positive for right-tailed distributions (right tail is longer);
negative for left-tailed distributions (left tail is longer).
Kurtosis – Kurtosis, measure of “tailedness” of a distribution,
expressed in relation to the Gaussian distribution, which has zero kurtosis.
Higher kurtosis corresponds to greater extremity of outliers (tails).
Kurtosis is positive for distributions with “fatter” tails than Gaussian distribution
(e.g., Laplace distribution). Kurtosis is negative for distributions with “thinner” tails
than Gaussian distribution (e.g., uniform distribution).
Entropy – Entropy, the average level of “information” needed to encode the image values.
1%, 5%, 10%, 25%, 50%, 75%, 90%, 95%, 99% – Percentile intensity values.
Maximum signal values for each percentage of voxels.
Example: If 75% percentile is 192, 75% of voxels have signal less than or equal to 192.
GLCM describes the second-order joint probability function of an image within ROI.
The element of this matrix with indices (i,j) represents the frequency at which
the combination of intensities i and j occur in two voxels in the image, which are
separated by a given distance D long a given angle.
The distance D from the center voxel is defined as the distance according
to the infinity norm.
GLCM describes how often pairs of voxels with specific intensities and
in a given spatial relationship occur in an image. The GLCM features
are the statistical measures of the GLCM matrix.
AuCor – Autocorrelation.
JointAvg – Joint Average.
ClstProm – Cluster Prominence.
ClstShade – Cluster Shade.
ClstTend – Cluster Tendency.
GLCMContr – GLCM Contrast.
GLCMCor – GLCM Correlation.
DiffAvg – Difference Average.
DiffEntr – Difference Entropy.
DiffVar – Difference Variance.
AngSecMom – Angular Second Moment.
JointEntr – Joint Entropy.
FirstMeasInfoCor – First Measure Information Correlation.
SecMeasInfoCor – Measure Information Correlation.
InvDiffMom – Inverse Difference Moment.
InvDiffMomNorm – Inverse Difference Moment Normalized.