Dynamic (4D) images are often analyzed to derive quantitative
parameters of organs and tissues. FireVoxel offers a selection
of 4D processing tools under the Dynamic Analysis menu tab.
Commonly used 4D processing tasks can be accessed by selecting
Dynamic Analysis > Calculate Parametric Map.
This command enables various semiquantitative analysis tasks
(signal, signal integral, peak analysis, etc.) as well as
model analysis for DWI MRI and IVIM, DCE MRI, relaxometry
(measurements of T1, T1rho and T2 (or T2*) relaxation times),
and others. The analysis can be performed for ROI-averaged
curves, or voxel by voxel - for a part of the image within an ROI
or for the entire image.
This section describes the main steps of using this command.
The details are provided in sections describing particular workflows.
Use File > Open DICOM to open browse-for-folder
dialog and select the directory with DICOM images. Once the user selects
the directory, the DICOM Tree dialog is displayed.
Select the dynamic dataset and click Load.
See Open for details.
In most cases, FireVoxel determines the dynamic variable
(4th dimension, such as time, b-value, TE, etc.) automatically
from the information in the DICOM header. The user should verify
that the dynamic variable has been read correctly by scrolling
through the images using the Left and Right arrow keyboard keys.
The dynamic variable for the current image will be displayed
in the lower left corner of the software window.
You can also use Layer Control >
Info to view the header information.
The analysis is often done for parts of image rather than
the entire image. The relevant tissues and organs need to be
segmented prior to the analysis. The segmentation can be
performed manually, using the Paintbrush tool, or using
automatic tools (see Segmentation 3D: EdgeWave).
Segmentation will produce one or more ROI layers with
segmentation masks.
Compartmental modeling of dynamic contrast-enhanced experiments
usually requires an input function (or input functions).
The input function can be determined manually, or using
FireVoxel’s Image Derived Input Function tool,
or another method, and saved as a .txt file with at least
two columns containing: 1) time, and 2) signal intensity
(or concentration). This file needs to be created and saved
prior to modeling.
Select ROIs to be analyzed.
The analysis may be performed voxel-by-voxel for the entire image,
or only within a selected 3D ROI, or for a curve averaged over
a selected 3D ROI, all visible ROIs, or the entire image
(see Processing Options below).
If the analysis is to be performed for an ROI (or ROIs),
make sure that the ROI (or ROIs) of interest is/are visible
(see Layer Control).
To proceed with analysis, select Dynamic Analysis >
Calculate Parametric Map.
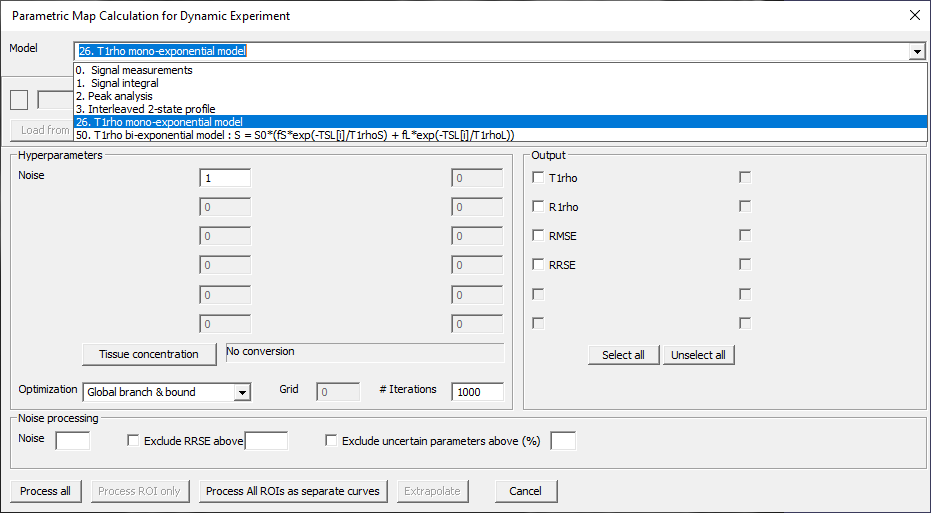
This command opens dialog that allows the user to select a model and
configure the analysis by selecting inputs, parameters, and outputs
(Parametric Map Calculation for Dynamic Experiment,
Fig. 28.1).
Fig. 28.1 Parametric Map dialog with models for an MRI dataset
with exponentially decaying signal.
Parametric Map Dialog Sections:
Model – Select an appropriate model from the drop-down menu
with a list of metrics and models compatible with the current dataset
(six models shown in Fig. 28.1 and Model 26 selected).
Each metric/model is numbered. The compatible models are automatically
selected based on the DICOM header information.
For a list of models, see Models.
Input function – Use these buttons (Load, Paste, Delete,
Attributes, View, Concentration) for loading and configuring
the input function for compartmental models.
For details, see DCE MRI Model Analysis
and Image-Derived Input Function.
Hyperparameters – Enter fixed input parameters or parameter limits
into these text boxes.
Outputs – Check boxes for selecting output parameters that will be
returned by the analysis. In voxel-based analysis, each output parameter
will create its own parametric map, each placed in a separate layer.
The model parameters that are not checked will be calculated,
but not shown as the results. Many models include a measure
of goodness of fit among output parameters.
See example in DWI > DWI Output.
Tissue Concentration – Button active for DCE MRI data for setting up
the signal-to-concentration conversion parameters for the tissue of interest.
See details in DCE Model Analysis >
Configure model analysis.
Optimization and Noise processing – This part contains parameters
of numerical methods used to obtain the parameters as well as rules
for rejecting unreliable results.
NOTE: Build 381. This part is under construction and not yet functional.
Processing Options:
The buttons at the bottom of the panel initiate the analysis
in one of the three regimes: on a voxel-by-voxel basis over the entire image,
or within an ROI, or for ROI-averaged curve or curves.
For examples of output results, see DWI Results.
Process All – Process the entire image voxel by voxel.
For each output parameter, the result will be displayed as a color map
residing in a new, automatically created, real-valued layer.
These new layers will be placed on top of all other
layers in the same document window as the original data.
This option is always available, though not always optimal,
as whole-image processing may be time-consuming.
Process ROI Only – Process the visible ROI voxel by voxel.
This option is available when 1) the active layer is a visible ROI layer
(other visible ROIs may be present in the document),
or 2) there is a single visible ROI layer (active or inactive).
The option is deactivated if no visible ROI layers are present
(even if one of them is the active layer), or multiple visible ROIs
are present, but the active layer is NOT an ROI.
The results are returned as new, color map layers, as in
Process All.
Process ROI/volume/All ROIs as a single curve –
Analyze the average signal intensity within the ROI at every value
of dynamic variable as a single curve determined from data
averaged over ROI(s) or the whole volume. The averaging volume
depends on the presence and visibility of ROI layers.
If there is the active ROI layer or a single visible ROI layer,
the data will will be averaged within this ROI and analyzed.
If there are multiple visible ROI layers present in the document,
but the active layer is NOT an ROI, this option is replaced with
Process All ROIs as separate curves. In this case, each ROI
is analyzed with the same method and parameters.
If there are NO visible ROI layers, and the active layer is NOT an ROI,
this option is replaced with Process volume as a single curve,
which averages the entire image at each dynamic point.
The result is returned in an output panel showing the data and fit curves
and a table of output parameters. These parameters can then be copied
to clipboard and pasted into a spreadsheet or other software.